The online course, Joy of Coding: Intro to Data Visualization and Correlation Screening, was specially created as a follow-up to the Joy of Coding: Intro to Computational Thinking and Coding course.
The Data Visualization and Correlation Screening course introduces students to various Python based ways of displaying data series as a means to discovering patterns. Students learn how to make a series plot in ways that tell the story underlying the data and to make it visually accessible in a color blind friendly manner. Students learn to tell from a plot if two variables are correlated, the degree of their correlation, and how to compute these empirically. They learn how to mine large datasets with many variables using correlation matrix mining (or thresholding), understand how correlation mining can lead to false discoveries. They understand how correlated variables need not be causally related and how to reason about spurious correlations.
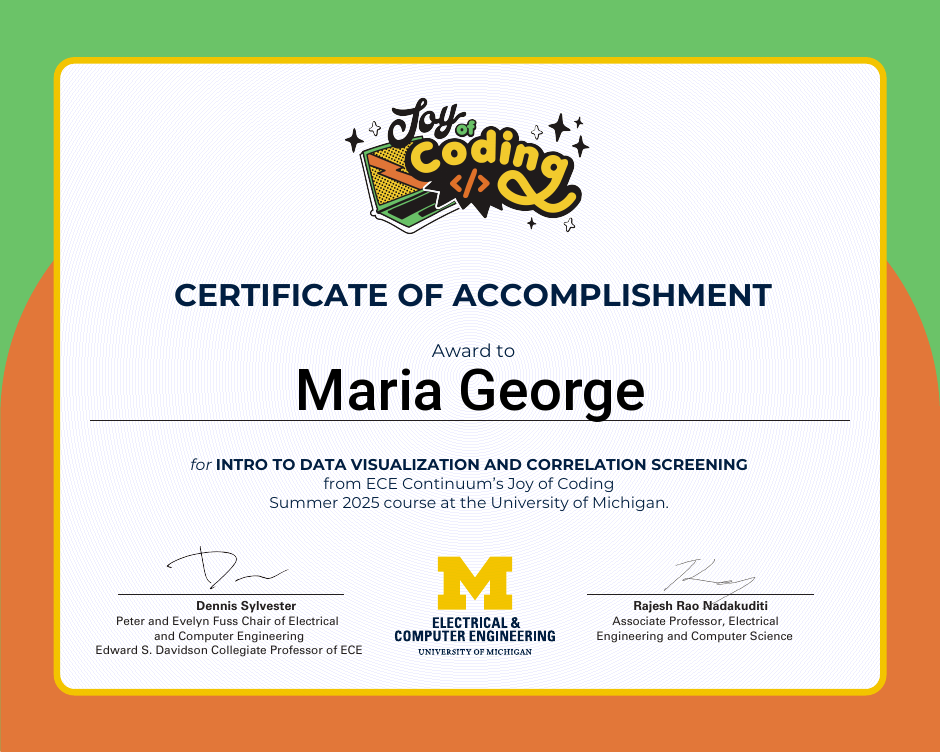
Accomplishment means that students have completed all the required assignments to earn the Intro to Data Visualization and Correlation Screening certificate.
Click here for a PDF version of the certificate you can download and print.